Food Security Calculator
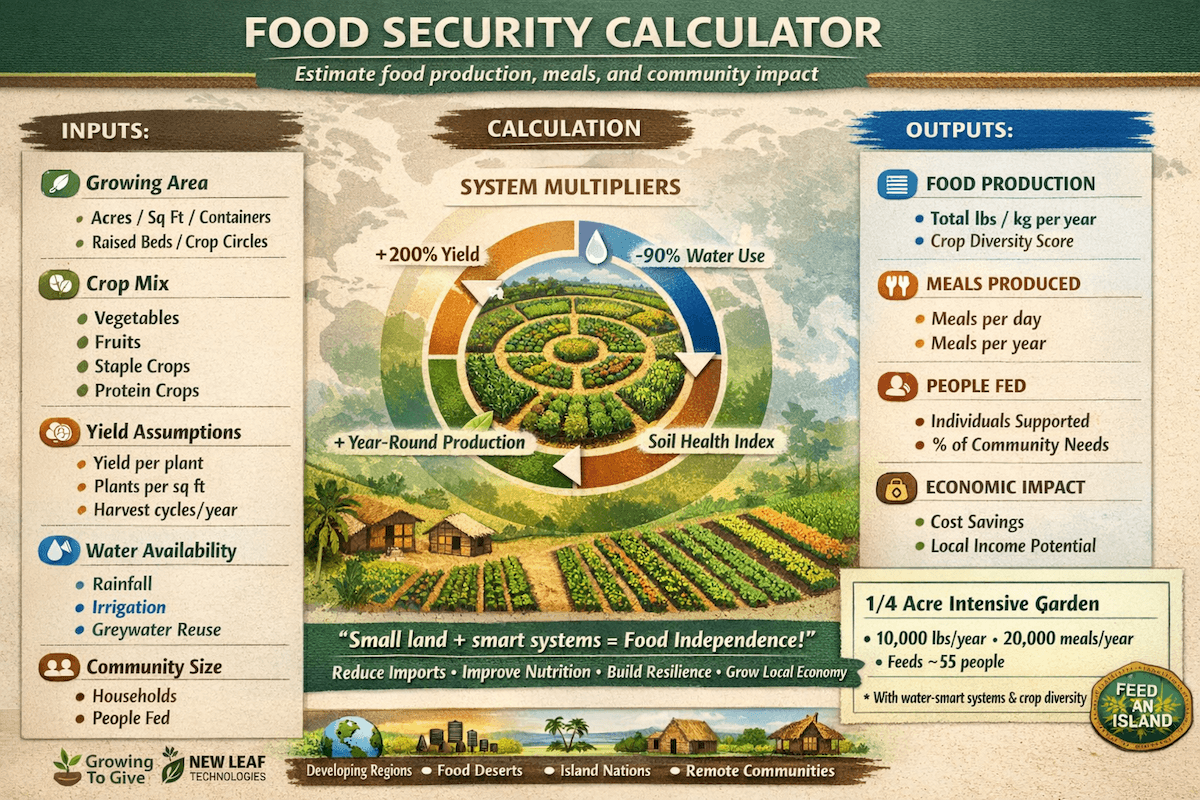
How many people can a Crop Circle Farm feed?
The Food Security Calculator estimates total crop production, input costs, and revenue potential for commercial-scale growing systems. This tool is designed for market farms, cooperatives, NGOs, grant applicants, and food-security projects.
Use this calculator to model yield per acre, planting density, water and fertilizer inputs, labor assumptions, and market pricing. Compare scenarios to evaluate return on investment (ROI), resource efficiency, and production capacity across different farm layouts and crop mixes.
For acreage-level planning, budget modeling, and profitability forecasting, this calculator provides clear insight into operational performance and ROI.
Knowing how to calculate crop production per acre is one of the most important skills a grower can develop. Whether you run a small urban farm, a market garden, or a diversified vegetable operation, yield estimates drive every major decision: what to plant, how much to plant, how to price your produce, and how to plan labor, irrigation, and inputs throughout the season.
Traditionally, farmers used a simple mathematical formula to estimate farm yield per acre. While accurate enough for its time, it required several manual steps and often involved a clipboard, a calculator, and a fair amount of guesswork. Today, tools like the Food Security Calculator on this page make it much easier to compare vegetable yield per acre and to visualize the impact of modern planting systems such as a Spiral Acre.
Quick note: the calculator below is the fastest way to model yields, but understanding the traditional method helps you sanity-check assumptions and spacing.
The old-school method to calculate farm yield still has value, especially if you want to understand how plant spacing and density affect production. A general formula for estimating production for vegetable crops per acre looks like this:
Production per Acre = (Plants per Acre) × (Yield per Plant)
To calculate these values, you need a few key measurements:
A common way to determine plants per acre is to convert your row and in-row spacing to feet, then divide the number of square feet in an acre by the space each plant occupies. Once you have plants per acre, you multiply by the expected yield per plant to get an estimate of total pounds of vegetables per acre.
This method is useful for teaching and planning, but it still leaves growers with a lot of guesswork—especially when you are comparing traditional row crops to high-density systems or new concepts like Crop Circle Farm grow models.
A simpler, modern way to calculate crop production per acre is to use the Food Security Calculator below. Instead of doing the math by hand, you select a vegetable from the dropdown menu and let the calculator instantly show you the estimated pounds produced on:
With just a click, a side-by-side comparison appears in the “Farm Acre” and “Spiral Acre” boxes. This makes it easy to see how much production you might gain by transitioning from a traditional layout to a Spiral Acre that is designed to maximize yield per square foot, reduce waste, and lower input costs.
Feel free to share this food security calculator infographic on your website or blog. Please include a link back to this page as the source.
Compare a conventional cultivated acre with a spiral acre using edible calories, people fed per year, households fed, and water use. This version keeps the same calculator logic but presents the tool in a cleaner planning layout.
Set your crop, yield, losses, calorie assumptions, and water use.
Side-by-side output for calories, people fed, and water savings.
—
Jump to the next tool, or explore supporting resources.
This calculator estimates calories produced, people fed per year, and water savings when comparing a conventional cultivated acre to a 1-acre spiral farm acre. Use it as a planning tool alongside our guides on food crisis, sustainable agriculture, conservation agriculture, and farming one acre.
“People fed” is calculated from total edible calories produced divided by an assumed daily calorie requirement over a year. It does not measure diet quality by itself. For real food sovereignty, plan a diverse crop mix (calorie crops + vegetables + protein + fats).
Water reliability is one of the biggest drivers of yield stability during heat waves and drought. A system that saves water (mulch, shade, drip, reuse) can maintain production with less risk, which improves food security even if average yields are similar.
You can build a baseline scenario and then clone it to test alternatives. Adjust crops, plant density, irrigation method, fertilizer strategy, or farm layout and compare yield, revenue, input use, and profit side by side. This makes it easy to compare a conventional field plan with a Crop Circle Farms spiral layout on the same footprint.
Start with “Mixed vegetables” for a quick estimate, then run multiple scenarios: one for calorie crops (potatoes/beans) and one for market crops (tomatoes/greens). You can also average your own yields and calories per pound from your harvest records.
Use conservative numbers first (e.g., +15% yield, −40% water), then test stronger management scenarios (e.g., +35% yield, −70% water). The best way to calibrate is to record actual yields and irrigation totals and update your assumptions each season.
Yes. Convert “people fed” into households fed, then multiply by your available acreage. Use the water output to estimate storage needs (tanks, rain capture) and to compare irrigation plans.