NDVI Crop Analysis
Using Satellite Vegetation Data to Monitor Crop Health
Normalized Difference Vegetation Index (NDVI) crop analysis is one of the most powerful tools in modern precision agriculture. By analyzing how plants reflect light in specific wavelengths, farmers can assess crop health, detect stress early, optimize inputs, and improve yields — often before visible symptoms appear in the field.
NDVI has become a foundational technology in smart agriculture systems, combining satellite imagery, drone mapping, and data analytics to transform raw field data into actionable insights.
NDVI stands for Normalized Difference Vegetation Index. It is a mathematical formula that uses light reflectance values from two parts of the electromagnetic spectrum:
Healthy plants absorb most visible red light for photosynthesis and reflect near-infrared light due to their cellular structure. Stressed or sparse vegetation reflects more red light and less NIR.
The NDVI formula is:
The result produces a value between -1 and +1:
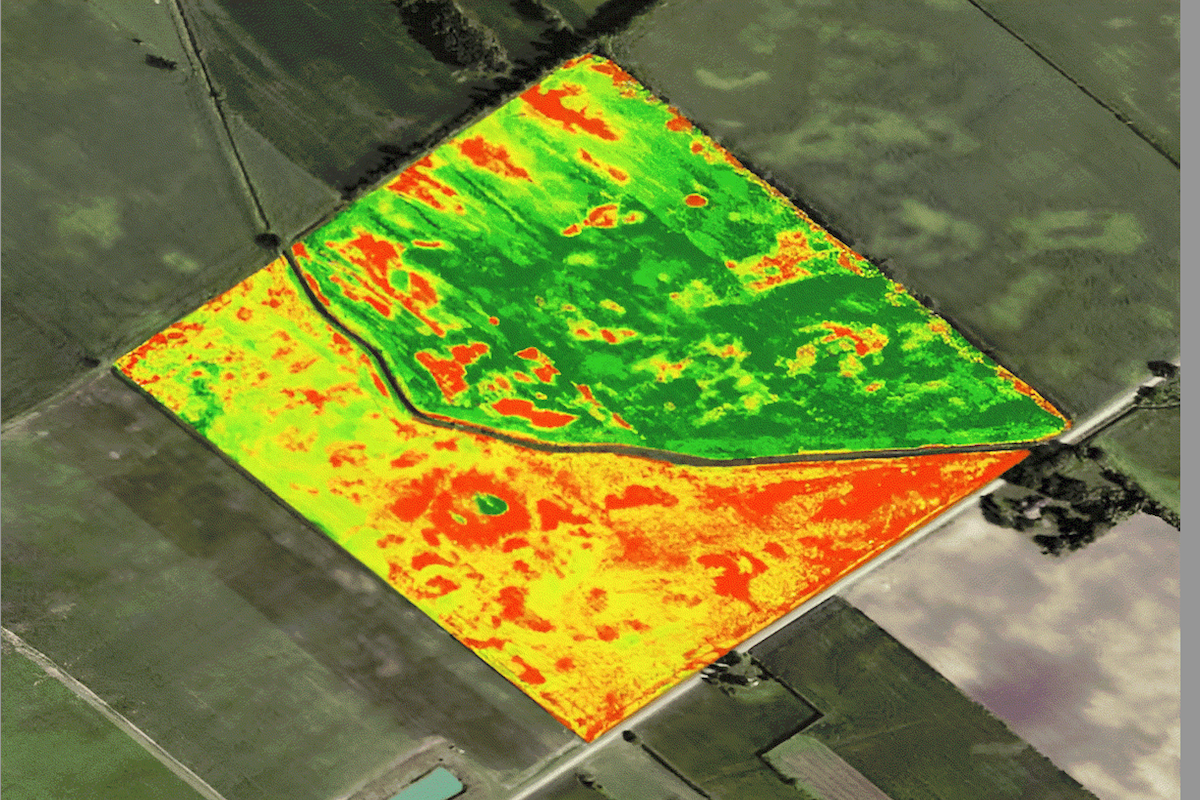
These values are typically displayed as color-coded maps, with dark green indicating strong plant vigor and red or yellow signaling stress.
Traditional crop monitoring relies on visual inspection. However, by the time yellowing leaves or wilting appear, stress has often already reduced yield potential.
NDVI allows farmers to:
Because NDVI can be measured via satellite, aircraft, or drone, it enables large-scale monitoring across hundreds or thousands of acres.
Consider a 500-acre corn field. Mid-season satellite NDVI imagery shows uneven zones of reduced NDVI values (0.42–0.48) compared to healthier areas at 0.65–0.72.
Field scouting confirms lighter green coloration in low-NDVI zones. Soil testing reveals nitrogen deficiency.
Using NDVI zone mapping, the farmer applies variable-rate nitrogen only to deficient areas rather than broadcasting fertilizer across the entire field.
Results:
NDVI enables precision nutrient management rather than guesswork.
In a California almond orchard, drone-based NDVI mapping identifies a row with consistently lower NDVI values.
Inspection reveals a partially clogged irrigation line affecting that zone. Without NDVI, the problem might not have been visible until tree stress became severe.
By correcting irrigation early, the grower prevents:
NDVI acts as an early-warning system for water management.
After planting soybeans, a grower uses NDVI imagery 10–14 days post-emergence.
The NDVI map reveals uneven emergence in several strips of the field. Further investigation finds a planter depth issue caused by worn row-unit components.
Because the issue is identified early:
NDVI provides rapid post-planting performance evaluation.Crop smart irrigation systems use NDVI data to adjust watering zones in real time.
In wheat fields, fungal diseases can spread rapidly. NDVI imagery often reveals disease stress before discoloration is visible at canopy level.
Areas with sudden NDVI decline may indicate:
Instead of spraying fungicide across the entire field, growers can target affected zones.
This reduces:
NDVI data can come from multiple platforms:
Public sources like Sentinel-2 and Landsat provide free NDVI data at varying resolution levels. Commercial providers offer higher resolution and more frequent imagery.
Advantages:
Limitations:
Drones equipped with multispectral cameras provide:
Ideal for:
Used in large-scale commercial agriculture where high-resolution imagery across extensive acreage is required.
NDVI is most powerful when integrated into broader smart agriculture systems:
Combining NDVI with soil testing data enables zone management strategies that optimize input efficiency.
While powerful, NDVI is not perfect.
Bare soil can distort readings in early growth stages.
In very dense vegetation, NDVI values may plateau and fail to differentiate between high-vigor zones.
NDVI detects stress but does not identify the exact cause. Field scouting is still required.
Cloud cover can delay satellite data acquisition.
NDVI is the foundation, but other indices provide additional insights:
These refine stress detection and improve decision accuracy.
NDVI also plays a role in regenerative systems by:
For farmers focused on sustainability, NDVI provides measurable performance data.
NDVI-based decision-making can result in:
Over multiple seasons, data-driven management increases profitability and reduces environmental footprint.
With AI-driven analytics, machine learning models now interpret NDVI patterns automatically, generating:
As satellite constellations increase resolution and revisit frequency, NDVI analysis is becoming near real-time.
NDVI crop analysis represents a shift from reactive to proactive agriculture. Instead of waiting for visible crop damage, farmers can detect subtle stress patterns early and respond with precision.
By combining satellite technology, data analytics, and agronomic expertise, NDVI transforms crop monitoring from visual estimation into measurable science.
For modern farms seeking higher efficiency, reduced input waste, and climate resilience, NDVI is not just a tool — it is a foundational technology in the evolution of smart agriculture.